I had this 1 Elasticsearch node that had higher load than his colleagues.
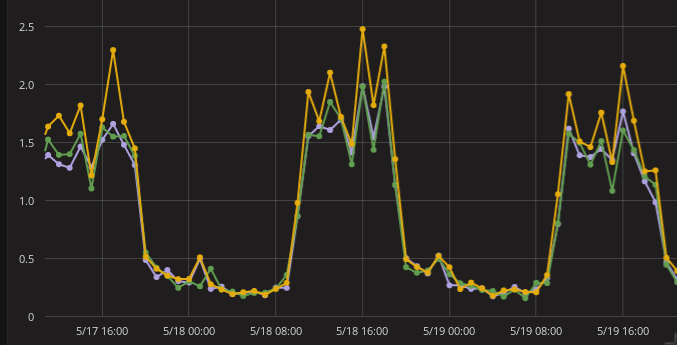
Previously, they were all living in perfect harmony
It all started when I rebooted the hypervisor the elastic node was on.
I looked in the KVM virsh files to see if the node had differences with the others. I noticed only this node wasn’t using the `virtio` driver for network and disk. I changed from `ide` and `e1000` driver to `virtio` for disk and network respectively. Rebooted the node but still couldn’t match the performance of his counterparts.
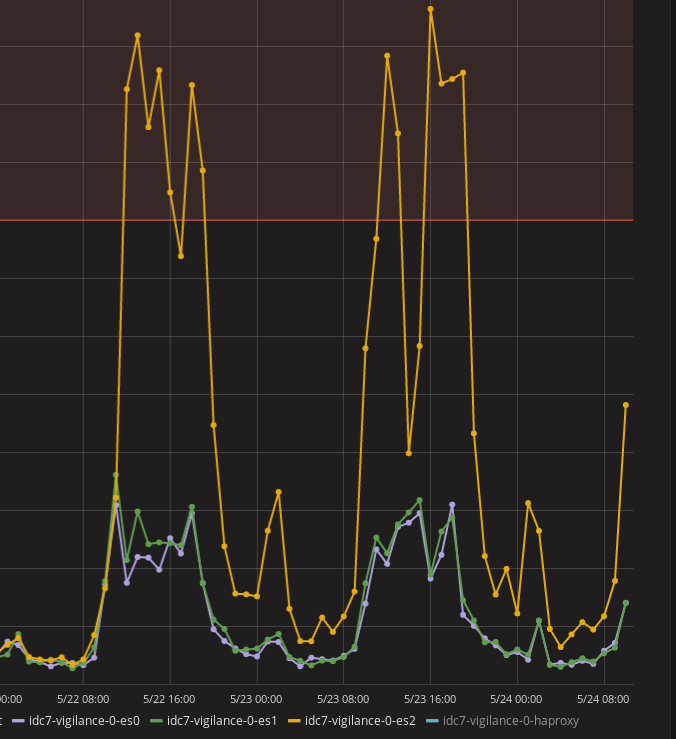
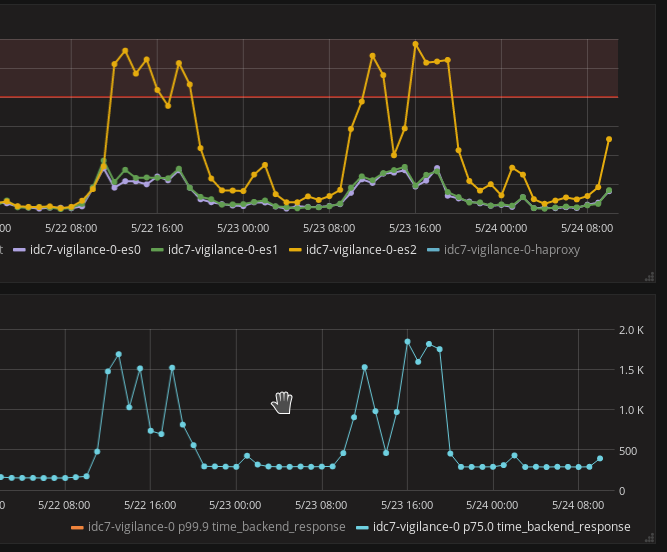
This problem had to be solved because the ElasticSearch cluster performance is directly affected by the slowest node in the cluster. If a node is slow, it’s better it’s not in the cluster. The 75h percentile requests was more than 1.5s. Usually it was around 400ms in peak hours. My 99.9th percentile exceeded 50 seconds. It was really dangerous. The cluster receives 1 million documents per minute.
`iotop -a` showed the same processes running but had high IO on `[jbd2/vdb-8]`. It just confirmed our problem. But no solution as of yet.
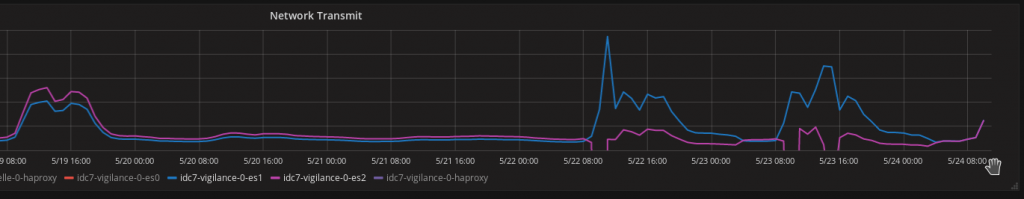
I noticed on the network graph that the node was not able to send more than 600MB per 5 mins at all times when previously it could.
There must be some kind of restriction on network. It must be when the hypervisor rebooted, the network negotiation had some issues. Comparing values from 2 hypervisors confirmed the hypothesis
root@hypervisor0:~# mii-tool eth0
eth0: negotiated 100baseTx-FD, link ok

root@hypervisor1:~# mii-tool eth0
eth0: negotiated 1000baseT-FD flow-control, link ok
We can see the speed difference is major here. The VM reported high disk IO because Ceph relies on network to read/write data.
Hi, so did you resolve this?