Elasticsearch error with python datetime: “Caused by: java.lang.IllegalArgumentException: Invalid format: “” is too short”

During normal usage, we got no loss of information on our Elasticsearch cluster. It was about 200 entries per second. We stressed tested the platform by doing bulks inserts at 7000 entries/s. We started seeing data getting lost.

It seems like the date format is not valid but the code has not been changed and there are no if-else statement where there could have been a possibility of echoing the datetime using a different branch. We are returning the time by the python function `datetime.isoformat(‘ ‘)`. Why would the same line of code produce 2 different outputs under heavy stress?

[2017-05-30T15:03:30,562][DEBUG][o.e.a.b.TransportShardBulkAction] [idc7-citadelle-0-es0] [proxydns-2017-05-30][0] failed to execute bulk item (index) BulkShardRequest [[proxydns-2017-05-30][0]] containing [1353] requests
org.elasticsearch.index.mapper.MapperParsingException: failed to parse [date.date_answer]
        at org.elasticsearch.index.mapper.FieldMapper.parse(FieldMapper.java:298) ~[elasticsearch-5.3.0.jar:5.3.0]
        at org.elasticsearch.index.mapper.DocumentParser.parseObjectOrField(DocumentParser.java:450) ~[elasticsearch-5.3.0.jar:5.3.0]
        at org.elasticsearch.index.mapper.DocumentParser.parseValue(DocumentParser.java:576) ~[elasticsearch-5.3.0.jar:5.3.0]
        at org.elasticsearch.index.mapper.DocumentParser.innerParseObject(DocumentParser.java:396) ~[elasticsearch-5.3.0.jar:5.3.0]
        at org.elasticsearch.index.mapper.DocumentParser.parseObjectOrNested(DocumentParser.java:373) ~[elasticsearch-5.3.0.jar:5.3.0]
        at org.elasticsearch.index.mapper.DocumentParser.parseObjectOrField(DocumentParser.java:447) ~[elasticsearch-5.3.0.jar:5.3.0]
        at org.elasticsearch.index.mapper.DocumentParser.parseObject(DocumentParser.java:467) ~[elasticsearch-5.3.0.jar:5.3.0]
        at org.elasticsearch.index.mapper.DocumentParser.innerParseObject(DocumentParser.java:383) ~[elasticsearch-5.3.0.jar:5.3.0]
        at org.elasticsearch.index.mapper.DocumentParser.parseObjectOrNested(DocumentParser.java:373) ~[elasticsearch-5.3.0.jar:5.3.0]
        at org.elasticsearch.index.mapper.DocumentParser.internalParseDocument(DocumentParser.java:93) ~[elasticsearch-5.3.0.jar:5.3.0]
        at org.elasticsearch.index.mapper.DocumentParser.parseDocument(DocumentParser.java:66) ~[elasticsearch-5.3.0.jar:5.3.0]
        at org.elasticsearch.index.mapper.DocumentMapper.parse(DocumentMapper.java:277) ~[elasticsearch-5.3.0.jar:5.3.0]
        at org.elasticsearch.index.shard.IndexShard.prepareIndex(IndexShard.java:532) ~[elasticsearch-5.3.0.jar:5.3.0]
        at org.elasticsearch.index.shard.IndexShard.prepareIndexOnPrimary(IndexShard.java:509) ~[elasticsearch-5.3.0.jar:5.3.0]
        at org.elasticsearch.action.bulk.TransportShardBulkAction.prepareIndexOperationOnPrimary(TransportShardBulkAction.java:447) ~[elasticsearch-5.3.0.jar:5.3.0]
        at org.elasticsearch.action.bulk.TransportShardBulkAction.executeIndexRequestOnPrimary(TransportShardBulkAction.java:455) ~[elasticsearch-5.3.0.jar:5.3.0]
        at org.elasticsearch.action.bulk.TransportShardBulkAction.executeBulkItemRequest(TransportShardBulkAction.java:143) [elasticsearch-5.3.0.jar:5.3.0]
        at org.elasticsearch.action.bulk.TransportShardBulkAction.shardOperationOnPrimary(TransportShardBulkAction.java:113) [elasticsearch-5.3.0.jar:5.3.0]
        at org.elasticsearch.action.bulk.TransportShardBulkAction.shardOperationOnPrimary(TransportShardBulkAction.java:69) [elasticsearch-5.3.0.jar:5.3.0]
        at org.elasticsearch.action.support.replication.TransportReplicationAction$PrimaryShardReference.perform(TransportReplicationAction.java:939) [elasticsearch-5.3.0.jar:5.3.0]
        at org.elasticsearch.action.support.replication.TransportReplicationAction$PrimaryShardReference.perform(TransportReplicationAction.java:908) [elasticsearch-5.3.0.jar:5.3.0]
        at org.elasticsearch.action.support.replication.ReplicationOperation.execute(ReplicationOperation.java:113) [elasticsearch-5.3.0.jar:5.3.0]
        at org.elasticsearch.action.support.replication.TransportReplicationAction$AsyncPrimaryAction.onResponse(TransportReplicationAction.java:322) [elasticsearch-5.3.0.jar:5.3.0]
        at org.elasticsearch.action.support.replication.TransportReplicationAction$AsyncPrimaryAction.onResponse(TransportReplicationAction.java:264) [elasticsearch-5.3.0.jar:5.3.0]
        at org.elasticsearch.action.support.replication.TransportReplicationAction$1.onResponse(TransportReplicationAction.java:888) [elasticsearch-5.3.0.jar:5.3.0]
        at org.elasticsearch.action.support.replication.TransportReplicationAction$1.onResponse(TransportReplicationAction.java:885) [elasticsearch-5.3.0.jar:5.3.0]
        at org.elasticsearch.index.shard.IndexShardOperationsLock.acquire(IndexShardOperationsLock.java:147) [elasticsearch-5.3.0.jar:5.3.0]
        at org.elasticsearch.index.shard.IndexShard.acquirePrimaryOperationLock(IndexShard.java:1654) [elasticsearch-5.3.0.jar:5.3.0]
        at org.elasticsearch.action.support.replication.TransportReplicationAction.acquirePrimaryShardReference(TransportReplicationAction.java:897) [elasticsearch-5.3.0.jar:5.3.0]
        at org.elasticsearch.action.support.replication.TransportReplicationAction.access$400(TransportReplicationAction.java:93) [elasticsearch-5.3.0.jar:5.3.0]
        at org.elasticsearch.action.support.replication.TransportReplicationAction$AsyncPrimaryAction.doRun(TransportReplicationAction.java:281) [elasticsearch-5.3.0.jar:5.3.0]
        at org.elasticsearch.common.util.concurrent.AbstractRunnable.run(AbstractRunnable.java:37) [elasticsearch-5.3.0.jar:5.3.0]
        at org.elasticsearch.action.support.replication.TransportReplicationAction$PrimaryOperationTransportHandler.messageReceived(TransportReplicationAction.java:260) [elasticsearch-5.3.0.jar:5.3.0]
        at org.elasticsearch.action.support.replication.TransportReplicationAction$PrimaryOperationTransportHandler.messageReceived(TransportReplicationAction.java:252) [elasticsearch-5.3.0.jar:5.3.0]
        at org.elasticsearch.transport.RequestHandlerRegistry.processMessageReceived(RequestHandlerRegistry.java:69) [elasticsearch-5.3.0.jar:5.3.0]
        at org.elasticsearch.transport.TransportService$7.doRun(TransportService.java:618) [elasticsearch-5.3.0.jar:5.3.0]
        at org.elasticsearch.common.util.concurrent.ThreadContext$ContextPreservingAbstractRunnable.doRun(ThreadContext.java:613) [elasticsearch-5.3.0.jar:5.3.0]
        at org.elasticsearch.common.util.concurrent.AbstractRunnable.run(AbstractRunnable.java:37) [elasticsearch-5.3.0.jar:5.3.0]
        at java.util.concurrent.ThreadPoolExecutor.runWorker(ThreadPoolExecutor.java:1142) [?:1.8.0_121]
        at java.util.concurrent.ThreadPoolExecutor$Worker.run(ThreadPoolExecutor.java:617) [?:1.8.0_121]
        at java.lang.Thread.run(Thread.java:745) [?:1.8.0_121]
Caused by: java.lang.IllegalArgumentException: Invalid format: "2017-05-30 13:03:11" is too short
        at org.joda.time.format.DateTimeParserBucket.doParseMillis(DateTimeParserBucket.java:187) ~[joda-time-2.9.5.jar:2.9.5]
        at org.joda.time.format.DateTimeFormatter.parseMillis(DateTimeFormatter.java:826) ~[joda-time-2.9.5.jar:2.9.5]
        at org.elasticsearch.index.mapper.DateFieldMapper$DateFieldType.parse(DateFieldMapper.java:242) ~[elasticsearch-5.3.0.jar:5.3.0]
        at org.elasticsearch.index.mapper.DateFieldMapper.parseCreateField(DateFieldMapper.java:462) ~[elasticsearch-5.3.0.jar:5.3.0]
        at org.elasticsearch.index.mapper.FieldMapper.parse(FieldMapper.java:287) ~[elasticsearch-5.3.0.jar:5.3.0]
        ... 40 more

It turns out that during stress tests, logs with a wider range of timestamps will be produced. Lemme illustrate it using this little python script for example.

import datetime

lol = datetime.datetime.fromtimestamp(1496211943.123)
print lol.isoformat(' ') # 2017-05-31 10:25:43.123000
lol = lol + datetime.timedelta(milliseconds=500) # we add 500 milliseconds to it. 
print lol.isoformat(' ') # 2017-05-31 10:25:43.623000
lol = lol - datetime.timedelta(milliseconds=623) # we substract 623 milliseconds. What will the result be?
print lol.isoformat(' ')  # 2017-05-31 10:25:43

Noticed how the format changed? I was expecting the output to be `2017-05-31 10:25:43.000000`. During normal usage, it is highly unlikely for someone to do requests at exactly 0 milliseconds. Even if they did, the data loss would be very little and non-detectable. By doing the stress test, what was very improbable become more probable. We detected it.

But why did the stupid format had to change? Reading the official documentation of the datetime library of python, it saw this:

datetime.isoformat([sep])

Return a string representing the date and time in ISO 8601 format, YYYY-MM-DDTHH:MM:SS.mmmmmm or, if microsecond is 0, YYYY-MM-DDTHH:MM:SS [1]

Why did they choose to do this? No idea. Anyways, I resorted to write my own format of which I would be sure not to have this problem again.

print lol.strftime('%Y-%m-%d %H:%M:%S.%f')

[1] https://docs.python.org/2/library/datetime.html
5 Reasons why should you use Reverse Proxies such as HAProxy?

1. Security

Port Limitations

As a business owner or system administrator, security is your priority. Competitors or evil hackers shouldn’t have the opportunity to hinder your business processes causing you to lose money. A reverse proxy will expose only e.g. port 80 and 443 on your website domain name. Your web server is not exposed to the public to be attacked on SSH, MySQL port or any other service it might have on.

Note of warning: A hacker can still gain access to your system if your web application has security vulnerabilities such as MySQL Injection vulnerability.

IP Based ACLs

Almost all popular CMS have a back-office or management section for administrative purposes. Problem is everyone has access to these back-office links and hence bots can brute-force the usernames and password to gain access to private informations.

acl is_admin path_beg /wp-admin
acl is_local src 192.168.100.0/24
http-request deny if !is_local is_admin

In this example, if someone tries to access a wordpress admin panel from an IP other than the subnet 192.168.100.0/24, the request will be denied

2. Performance monitoring

HAProxy can be configured to send logs to a syslog server (which can be local too). You can then analyze these logs and store them into a high-speed time series database such as ElasticSearch. You can use the Collectiva service to setup and analyze the logs for you

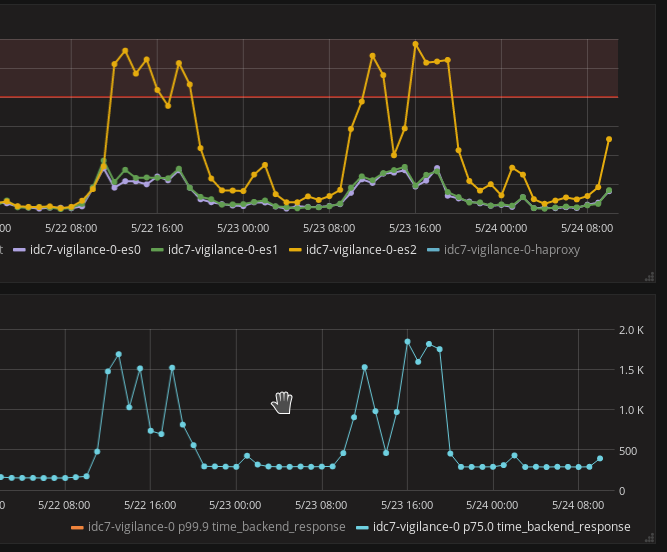
You can visualize the data so as to display the 75th percentile response time. Using percentiles instead of mean average provides a better view on the real world performance as outliers are ironed out. An example is let’s say your website usually serves clients under 100ms 99% of the time but there is one cron that takes 1 minute to run every 5 minutes. Your average response time will be much higher. It becomes difficult to know when is the server actually slowing down.

The graph below shows the 75th response timefrom HAProxy logs

3. SSL Certificate Management

Securing your website with SSL is no longer a luxury feature. It’s a must and it’s free.

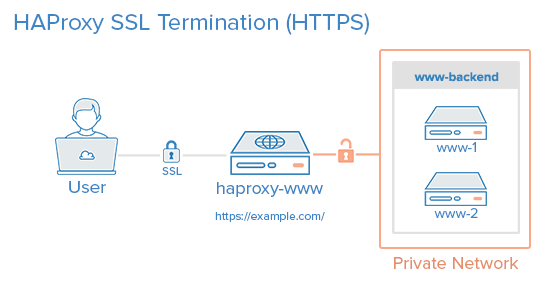
SSL termination is what I mostly use because it’s a lot easier to maintain.

Source: digitalocean.com

Your web application might be a simple PHP/Apache, NodeJS daemon, Python daemon whatever. Each of these applications have there own ways to implement SSL certificates in their configuration files or panels. I ain’t got time to go learn all these platforms to implement SSL on my websites. Now imagine for each web-service you have multiple server backends. It’s not easy to keep all the certificates in sync when you’re renewing the certificates.

Having a load balancer at the front handles all the certificates for all domains is really convenient. As a system administrator, I don’t have to care what the developers are doing as long as they speak HTTP.

NOTE: Your application needs to take into account the `XForwardedProto` of the HTTP header for this to work. Else you can just force the application to print https links all the time. 

4. Redundancy

Downtime is bad for business. No matter how good your servers are or how highly qualified your system administrators are, your servers and services are eventually going to fail at some point in time. The best you could do is plan for it. Having multiple servers for your website or webservice is the becoming the norm specially with the rise of containers such as LXC and Docker technologies.

The reverse proxy takes in all the requests, checks if there are servers capable of serving them then forwards the requests to the latter.

Let’s say you have 3 apache servers serving the same exact content and 1 of them dies, the load balancer will redirect the rest of requests to the other 2. The end-users nor your boss will know something is wrong unless you tell them something actually went wrong.

5. Load Balancing

We were born small. Through the years our body size increased till we reach our designated height. It’s the same principle with startup businesses. At first they don’t have  lots of clients and resources. Those who survive have to more and more clients to serve.

Having a load balancer helps you start a website with just 1 tiny backend server. As more requests come in, just replicate the backend server more and more until the all the end-users are served. And also when times are bad, you can also reduce the amount of backend servers.

Run your business lean.

6. Freedom of Infrastructure (Bonus)

Just a combination of all the points discussed above. I think the only constant in an IT infrastructure is reverse proxies/load balancers known as frontal servers. The rest should be able to quickly adapt to new technologies, programming languages and paradigms.

What is your favorite load balancer and why? Tell us in the comments

A sad news

HAProxy doesn’t yet support HTTP/2 protocol as of time of writing. It was supposed to be in HAProxy 1.6 but it’s not in version 1.7 yet.

High Load on one of ElasticSearch Node on Ceph

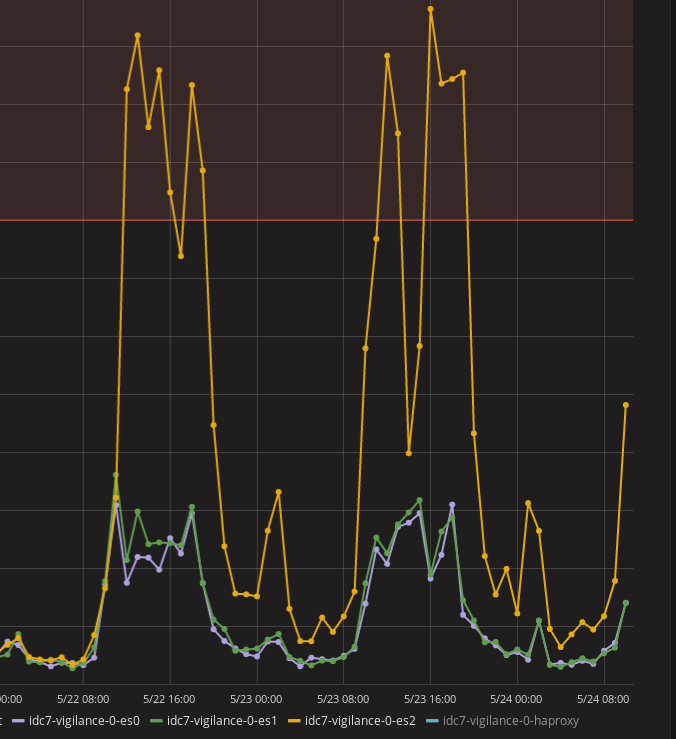
I had this 1 Elasticsearch node that had higher load than his colleagues.

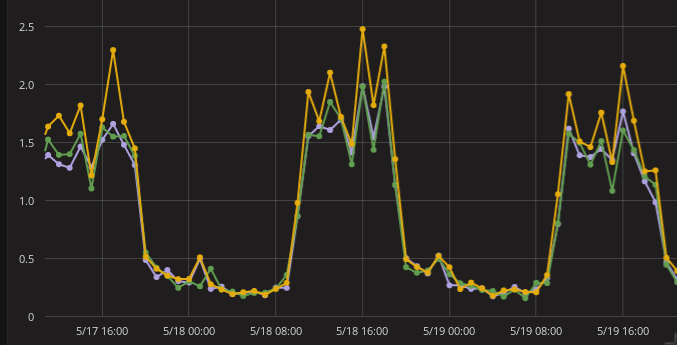
Previously, they were all living in perfect harmony

It all started when I rebooted the hypervisor the elastic node was on.

I looked in the KVM virsh files to see if the node had differences with the others. I noticed only this node wasn’t using the `virtio` driver for network and disk. I changed from `ide` and `e1000` driver to `virtio` for disk and network respectively. Rebooted the node but still couldn’t match the performance of his counterparts.

This problem had to be solved because the ElasticSearch cluster performance is directly affected by the slowest node in the cluster. If a node is slow, it’s better it’s not in the cluster. The 75h percentile requests was more than 1.5s. Usually it was around 400ms in peak hours. My 99.9th percentile exceeded 50 seconds. It was really dangerous. The cluster receives 1 million documents per minute.

`iotop -a` showed the same processes running but had high IO on `[jbd2/vdb-8]`. It just confirmed our problem. But no solution as of yet.

I noticed on the network graph that the node was not able to send more than 600MB per 5 mins at all times when previously it could.

There must be some kind of restriction on network. It must be when the hypervisor rebooted, the network negotiation had some issues. Comparing values from 2 hypervisors confirmed the hypothesis

root@hypervisor0:~# mii-tool eth0
eth0: negotiated 100baseTx-FD, link ok

root@hypervisor1:~# mii-tool eth0
eth0: negotiated 1000baseT-FD flow-control, link ok

We can see the speed difference is major here. The VM reported high disk IO because Ceph relies on network to read/write data.

Monitor your cluster farm with Collectiva (Beta), a product of nayarweb.com

Reading Files Line by Line in Python

You write a script in python which has to read a file, loop through each line to do some work. Seems easy right?

f = open('loulou.txt', 'r')
lines = f.readlines()
for line in lines:
	print line

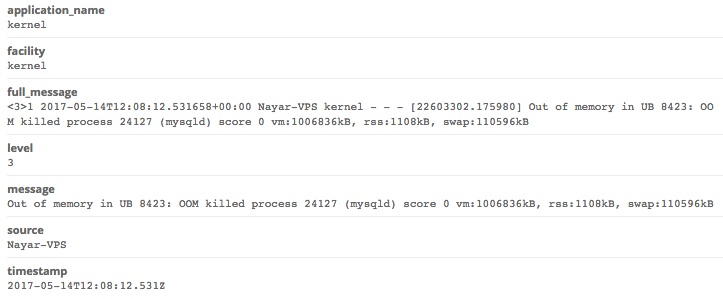
Problem is when your file becomes big, let’s say 1500MB, the code will still run on your development laptop but it will fail on a server on cloud with 1GB of RAM. You’ll have an Out Of Memory error which can lead to some very important process being killed if OOM priorities are not mastered.

You can use the Collectiva service by NAYARWEB.COM to get alerted near-realtime whenever Out of Memory occurs on one of your servers.

To fix the code above, you can read the file line by line from the disk:

f = open('loulou.txt', 'r')
for line in f:
        print line

Is this always better? No. The current version will run slightly slower than the first code depending on your storage backend.

It’s amazing how little differences like these can have a huge impact on production servers.

Happy Monitoring to all System Admins out there 🙂

Analysing Car Market Trends using Big Data Tools in Mauritius

Who hasn’t heard of Big Data in the 21th century? Big Data in itself isn’t much of a great deal as knowing how to extract useful information from the data. It is the analytics part which is the killer feature of Big Data. It comprises of both science and art!

source: www.fudzilla.com

The first step of Big Data solutions is to gather data. There are lots of ways in which you can achieve this. Manual Data Entry can still be done but you’ll require quite an army of minions for that. But I was not “evil” enough to convince the minions to work for me. So I had to find other ways: Facebook Graph API allows you to get feeds from your wall, car groups you’re in.

{
      “message”: “Renault Scenic
Rs138,000 – Vacoas, Plaines Wilhems, Mauritius

For sale Renault Scenic Year 2005,STEPTRONIC gearbox,fully executive,1500 cc Petrol,never accidented,comes with digital dashboard,armrest,electric mirrors,alloy wheels and panoramic sunroof”,
      “updated_time”: “2017-04-16T05:57:29+0000”,
      “id”: 14851777

},

Good news is that the data is in JSON format. Bad news is that the message field contains unstructured data. We have to extract the informations we want from it. I use Collectiva Beta service (from nayarweb.com) for data processing.

Collectiva Beta

Let’s extract the Make, Model, Price, Location and Year from the data. I use grok patterns on the message field.

Make and Model: ^%{NOTSPACE:make} %{NOTSPACE:model}

Year: (y(ea)*r|an(n*e*))\s*\:*\s*(?<year;int>[0-9]+) // works with an 96, year 2003, yr : 14, anne 2000

Price & Location: (((Rs|\$|£|₹)(?<price_string>([0-9,])*))|FREE)( – %{GREEDYDATA:location_string})?

Now we can just throw data at it. Some will get properly parsed, some not. But with enough data, you can still get some pretty graphs. In the future, hopefully I get an AI do the extracting for me.

Let’s get to the pretty parts now: graphs.

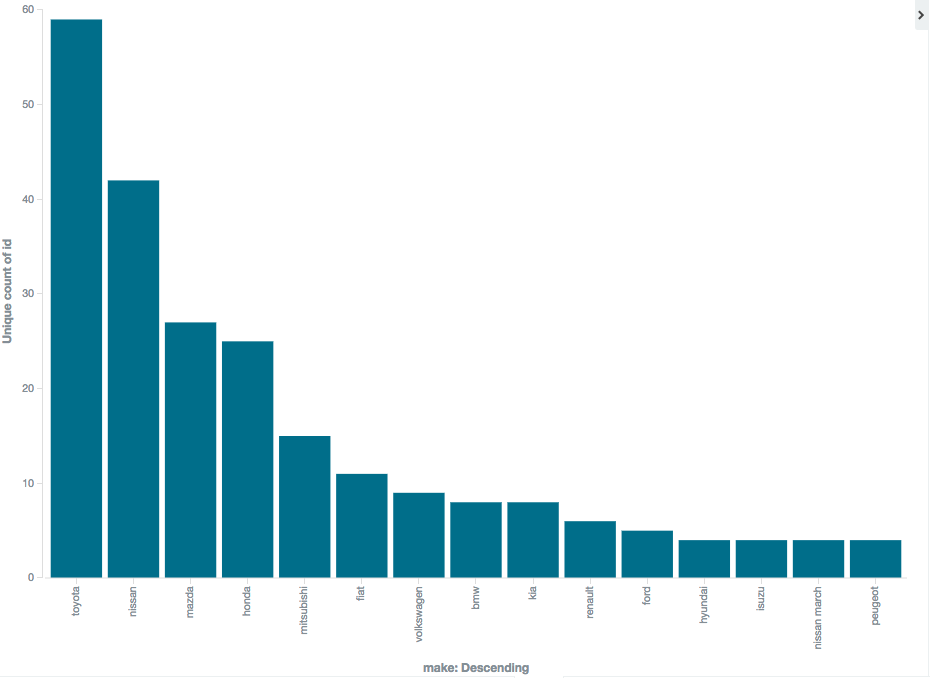
Which car makes are the most sold in Mauritius?

Easy: A Bar Chart

How many models are within each make?

No need to have another graph. We just split the split bars for models. Voila!

How much do the car models depreciate in Mauritius?

Notice that it is graphing the 50th percentile which is also known as median. Means are kinda useless because a single outlier can cause the graphs to be very skewed by a lot. We can show the 10th, 50th, 90th percentile on the same graph so that you can compare whether the car you’re buying falls between the accepted market price. Let’s say you want a Volkswagen Polo

You can see the same lines above are not split into 3 lines. I don’t have much variation here because I’ve been collecting data for only 4 days. The lines are supposed to smoothen over time and the accuracy will increase.

Wanna see the Big Picture? Welcome the Pi Chart

In this graph, I aggregated the data into Make, Model, Year and Price. All in 1 graph. It’s like magic nah?

Want to get into Big Data World?

If you have big databases sitting around, like for supermarket, warehouse, manufacturing and agriculture, or you run an SME or NGO and would like to benefit from the insights of Big Data tools feel free to contact me for a quotation.